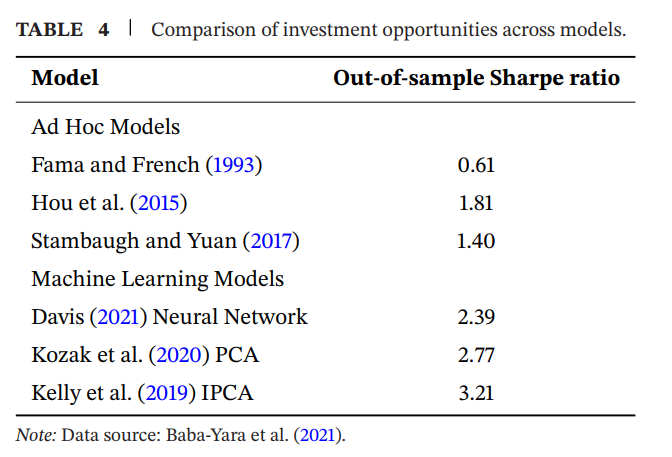



The Sharpe ratios reported in Table 4 appear implausibly high:
Fama-French (1993): 0.61 (reasonable)
Hou et al. (2015): 1.81
Kozak et al. (2020): 2.77
Kelly et al. (2019): 3.21
Concern: An out-of-sample Sharpe ratio of 3.21 for a long-short portfolio implies an annualized return of ~32% with 10% volatility. This exceeds virtually all documented anomaly returns and seems inconsistent with realistic transaction costs and practical constraints. How were these calculated? Did they account for transaction costs, turnover, or short-selling constraints? Without these, the “investment opportunities” they claim are largely illusory for actual investors.