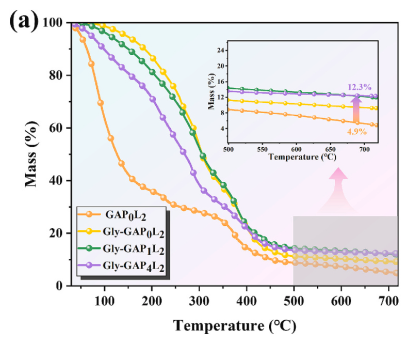
In Figure 6a, the TGA curves for GAP0L2, Gly-GAP0L2, Gly-GAP1L2, and Gly-GAP4L2 are shown. The authors claim in the text (Section 3.4, paragraph 1) that:
“The mass loss during 30–196 °C is attributed to free water evaporation, with 63.7% loss in GAP0L2.”
However:
– The onset of weight loss (T₅%) for GAP0L2 is shown as 48.9 °C in Table 1, yet from Figure 6a, it’s visually obvious that the major weight loss begins well before 50 °C.
– The slopes and curves for Gly-GAP0L2 and Gly-GAP1L2 appear almost parallel during 30–150 °C, but the authors claim Gly reduces evaporation due to hydrogen bonding with water — if so, why do their mass loss curves nearly overlap until ~150 °C?
-Is the reported T₅% value of 48.9 °C for GAP0L2 consistent with the TGA curve in Fig. 6a, and how do the nearly identical slopes for Gly-GAP samples support claims of improved water retention?