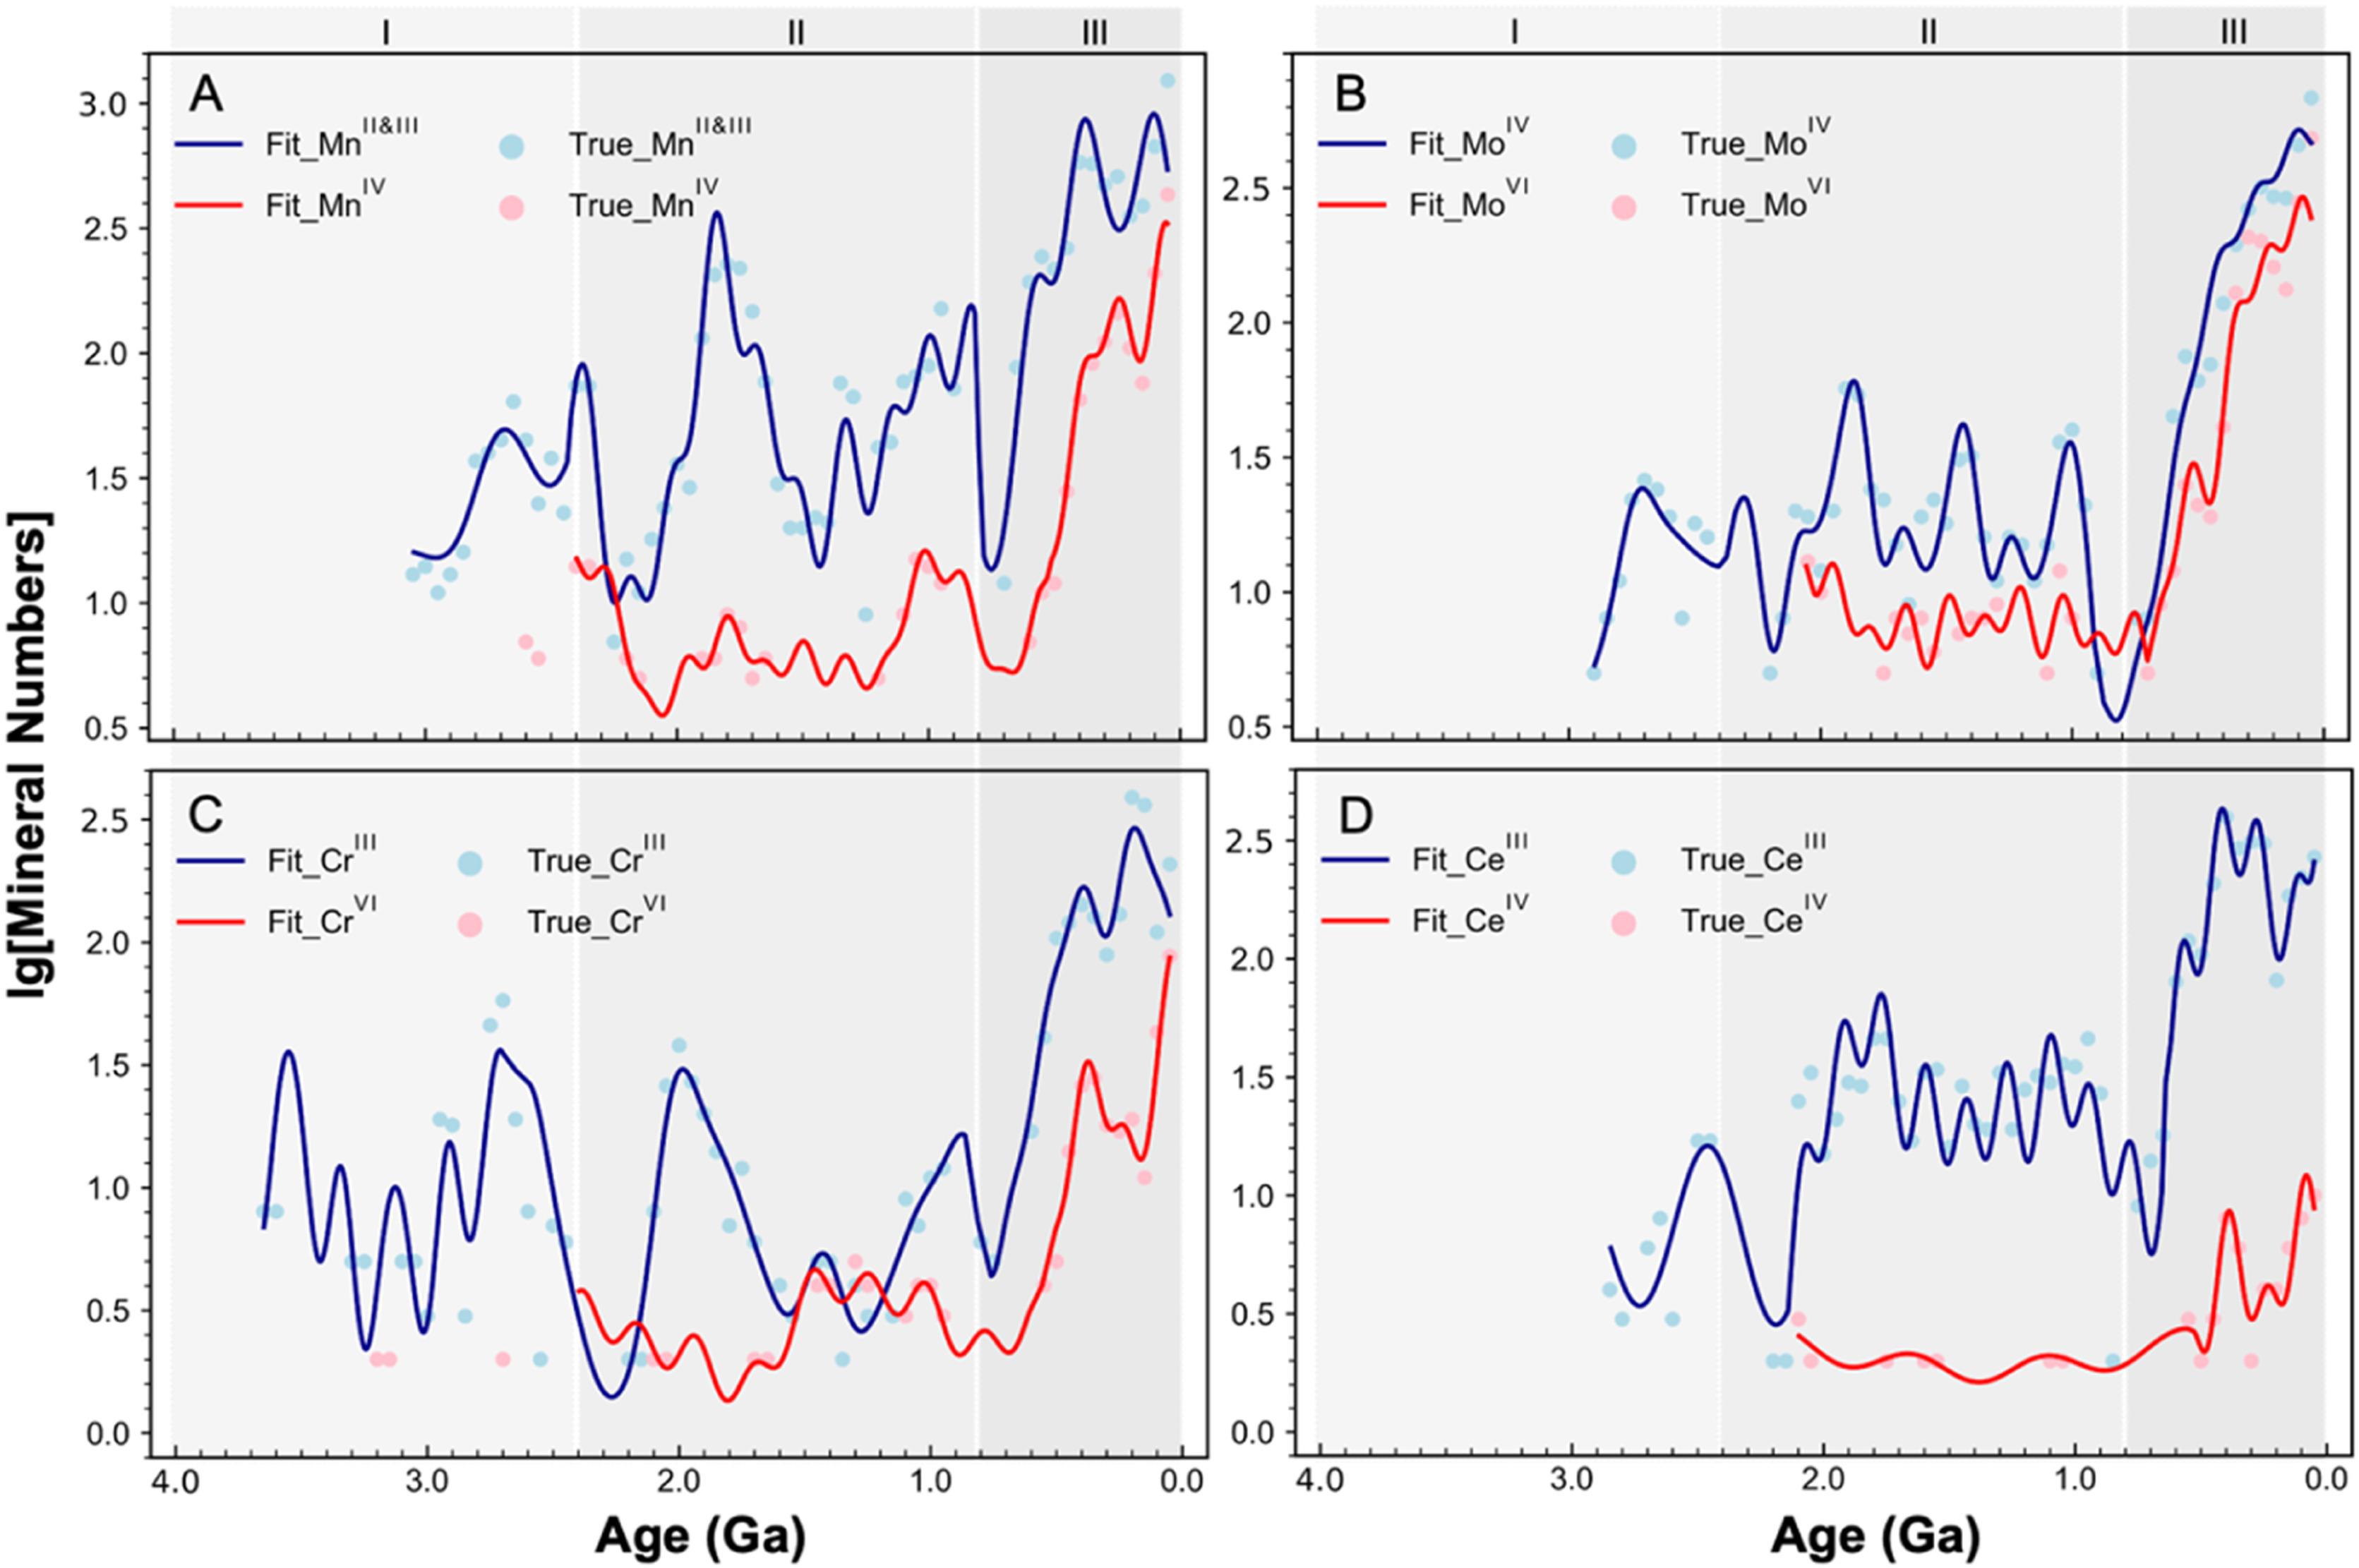
In Figure 5, you fitted the logarithmic counts of redox-sensitive mineral samples using third-order trigonometric Fourier series across the three evolutionary stages. Given that some categories, particularly high-valent minerals in Stage I, have relatively limited sample sizes, how do you ensure that the periodic trends identified are not artifacts of overfitting or sparse data rather than true geological cyclicity? Additionally, how did you account for potential sampling biases or preservation gaps that could artificially influence the perceived periodicity and thus affect the accuracy and precision of your fitted curves?