In Figure 3, ROS generation is quantified using three distinct methods—ABDA degradation (Fig. 3D), SOSG (Fig. 3L), and DHR123 (Fig. 3K)—each with potential limitations. ABDA is prone to aggregation and solvent-dependent reactivity, SOSG can artifactually amplify signals due to self-photosensitization, and DHR123 may react non-specifically with other oxidants.
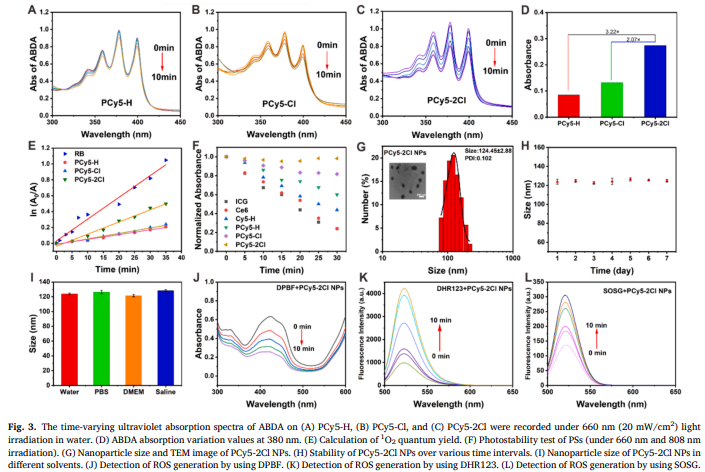
1. How were discrepancies in ROS yields reconciled between assays? For example, PCy5-2Cl’s ΦΔ=0.44 (SOSG/RB standard) appears inconsistent with the 3.22-fold ABDA increase (no absolute ΦΔ provided). Were parallel measurements performed under identical conditions?
2. Were probe-only controls (e.g., SOSG + light without PCy5-2Cl) included to account for background oxidation? The steep signal rise in Fig. 3L suggests possible SOSG self-sensitization, which could inflate 1O2 estimates.
3. Why was electron spin resonance (ESR) with TEMP/TEMPOH not employed to directly detect 1O2, given its specificity for singlet oxygen over other ROS?
4. ABDA data (Fig. 3A–C) were collected in DCM, while SOSG/DHR123 used aqueous media. How did solvent polarity differences affect ROS measurements, especially since 1O2 lifetime varies 10-fold between these environments?